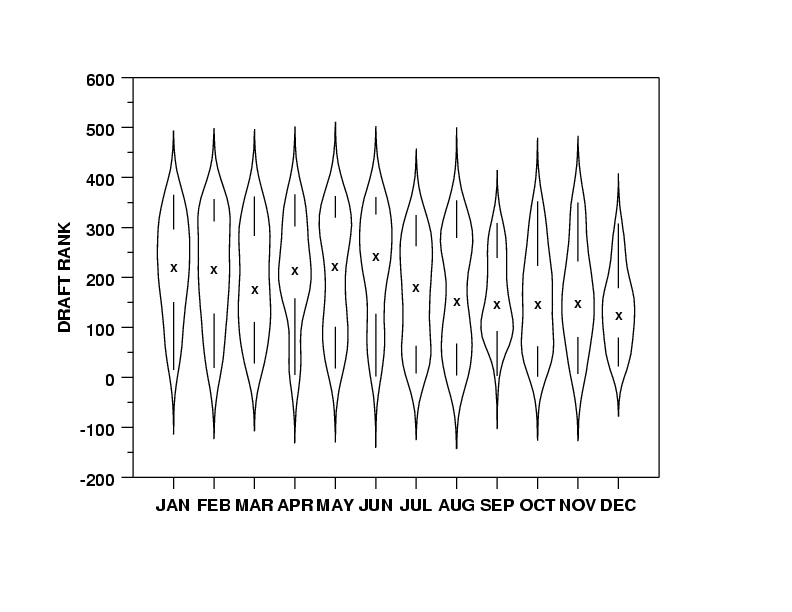
I came across the Violin Plot and thought it was an interesting approach to data visualization.

It is similar to a box plot, but shows more information about the stastical distribution of each data point.
I came across the Violin Plot and thought it was an interesting approach to data visualization.

It is similar to a box plot, but shows more information about the stastical distribution of each data point.